There is a painful truth about Qlik Cloud scalability that most people do not want to talk about. If you have spent any time in the world of business intelligence, you have likely heard the whispers. People worry that moving to the cloud means losing control over performance. They fear that as their data grows and their user base expands, the system will eventually hit a wall that they cannot move.
The painful truth is not that Qlik Cloud cannot scale. The painful truth is that most teams scale the wrong things first. They scale their app count, their reload frequency, and their user permissions without a plan. Then, when things slow down, they blame the platform.
In reality, Qlik Cloud offers scalability strengths that often surpass what is possible in a traditional Qlik Sense on-premises environment. The secret is understanding how to use those strengths correctly. This post explores the reality of scaling in Qlik Cloud and how it compares to the old way of doing things.
If you are planning a major growth phase or a migration, we can help you sanity check your approach at Arc Qlik Consulting Services.
The Real Reason People Doubt Qlik Cloud Scalability
When a team says Qlik Cloud does not scale, they are usually reacting to symptoms of a deeper issue. Scalability doubt usually starts when one of these things happens:
Dashboards begin to feel sluggish as more users log in simultaneously.
Reload windows become crowded and lead to frequent failures.
The number of apps grows so fast that nobody knows which one is the source of truth.
Governance becomes a bottleneck that stops new projects from moving forward.
These are not platform failures. These are scaling symptoms. They are almost always caused by design choices rather than platform limits. The shift from Qlik Sense on premises to Qlik Cloud requires a shift in how you manage growth.
What Scalability Actually Means in Qlik
To scale effectively, you have to measure the right things. Scalability is not just one number. It is a combination of several different dimensions that all need to grow together.
User scalability – Add more people without breaking access or performance.
Data scalability – Handle more volume and history without creating bloated apps.
App scalability – Support more dashboards without duplication and chaos.
Reload scalability – Refresh data reliably as your frequency grows.
Governance scalability – Maintain standards without blocking your teams.
Scalability Dimensions and What to Measure
Dimension
What Grows
What Usually Breaks First
What to Monitor
Users
Adoption across roles
Permissions and content sprawl
Spaces, roles, and app ownership
Data
History and granularity
App size and reload time
App size and reload duration
Apps
Number of published apps
Duplicate logic and inconsistent KPIs
App inventory and reuse rates
Reloads
Frequency and scheduling
Reload queue conflicts
Reload windows and failure rates
Governance
Teams and domains
Slow approvals and bottlenecks
Space design and publishing flow
The Reframe: Why Qlik Cloud is Actually Stronger
The painful truth is that many teams bring their old Qlik Sense habits into Qlik Cloud. They lift and shift their apps without redesigning their operating model. When you treat a cloud platform like a folder of files on a local server, scalability will always look bad.
Qlik Cloud is designed to be a governed product platform. When you use it that way, it scales much more cleanly than an on-premises environment. You no longer have to worry about scaling servers, managing nodes, or performing manual upgrades. The platform handles the infrastructure so you can focus on the data.
Qlik Cloud vs Qlik Sense: Scalability Differences
The way you scale in Qlik Cloud is fundamentally different from Qlik Sense on premises.
Infrastructure Ownership In Qlik Sense, scaling often means adding more hardware. You have to manage nodes, load balancing, and maintenance effort. In Qlik Cloud, that infrastructure management shifts away from your team. You scale by adjusting your plan and your app design rather than your server rack.
Standardization and Governance Qlik Cloud encourages the use of spaces and shared content patterns. This makes it easier to maintain standards as you grow. Qlik Sense environments often evolve into a collection of isolated apps that are difficult to govern at scale.
Growth Path Expanding in Qlik Cloud is a matter of configuration. You add capacity and features as your needs grow. Expanding an on-premises environment often requires a full project involving hardware procurement and software upgrades.
Qlik Cloud vs Qlik Sense Scalability at a Glance
Topic
Qlik Cloud
Qlik Sense (On Prem)
Scaling Effort
Focus on configuration and design
Focus on infrastructure and design
Growth Friction
Governance and app sprawl
Hardware limits and upgrades
Operations
Tenant-level management patterns
Server and node management patterns
Slowdown Causes
App design and reload strategy
App design and hardware constraints
Common Scalability Mistakes and How to Fix Them
Most scalability issues come down to a few common mistakes.
Mistake 1: The Giant App Many teams try to put every possible metric into a single massive app. As the data grows, the app becomes slow, and the reloads become fragile. The Fix: Split your apps by domain and audience. Use a curated data layer so multiple apps can share the same foundation without duplicating the data.
Mistake 2: Logic Duplication When every app has its own version of a “Gross Margin” calculation, you cannot scale. Eventually, the numbers will stop matching. The Fix: Standardize your business logic. Use shared resources and master items so that a change in one place updates everywhere.
Mistake 3: Competing Reload Schedules If every app is set to reload at 8:00 AM, your reload queue will spike, and failures will follow. The Fix: Stagger your reloads. Align the frequency with the actual business need. Not every app needs to refresh every hour.
A Simple Scalability Roadmap
Scaling is a journey that happens in phases. You do not need enterprise-level governance on day one, but you do need a path to get there.
Phase 1: The Pilot Focus on proving value with a small set of apps. Establish naming standards and a basic space model early. This prevents chaos from taking root.
Phase 2: Departmental Rollout Define a clear publishing workflow. Create a repeatable process for how data is moved and how apps are promoted from development to production.
Phase 3: Enterprise Scale Formalize ownership by business domain. Introduce app portfolio management to ensure that you are not supporting hundreds of apps that nobody uses.
How to Tell if You Are Scaling the Right Way
You can tell your scalability strategy is working if you see these signals:
Your reload success rates stay stable even as you add more data.
Your app inventory stays organized and easy to navigate.
Business definitions remain consistent across different dashboards.
New teams can join the platform without requiring a custom setup.
Ownership is clearly defined for every app and dataset in the tenant.
Warning Signs vs. Healthy Signals
Area
Warning Sign
Healthy Signal
Apps
Hundreds of near-duplicate apps
Clear reuse of data and logic
Reloads
Frequent failures during peak times
Predictable and staggered schedules
Governance
Everything requires a custom exception
Standard patterns work for most teams
Performance
Users complain that it feels slower
Performance is measured and stable
Conclusion
The painful truth about Qlik Cloud scalability is that it requires discipline. The platform can handle massive amounts of data and thousands of users, but it cannot fix a bad design. When you move away from old on-premises habits and embrace a governed, capacity-based model, Qlik Cloud becomes an incredibly powerful engine for growth.If you want to ensure your Qlik environment is built to last, we can help you design a strategy that scales with your business. Explore our Qlik Consulting Services to learn more.
Try Qlik Cloud for Free
If you want to see how Qlik Cloud scales for yourself, you can start a free 30-day trial. It is the best way to explore the platform, load your own data, and test the features we discussed today without any upfront commitment.
Government shutdowns create immediate operational challenges that ripple through every department. When staff are furloughed and budgets freeze, the work doesn’t stop. HR still needs to process payroll. Finance teams must track spending. Logistics departments have to manage contracts and inventory. The question isn’t whether these functions matter during a shutdown. The question is how agencies can maintain them with fewer people and limited resources. The answer lies in data automation platforms that reduce manual work, maintain data quality, and speed up recovery when normal operations resume.
The Real Cost of Manual Data Processes
Most government agencies still rely heavily on manual data entry, spreadsheet management, and person-dependent workflows. These systems work fine when everyone is at their desk. During a shutdown, they fall apart quickly.
Consider what happens in a typical HR department. Employee records need updating. Benefits require processing. Time and attendance data must be collected and verified. When half the team is furloughed, these tasks pile up. The backlog grows every day. When staff return, they face weeks of catch-up work before operations normalize.
Finance departments experience similar problems. Budget tracking stops. Invoice processing slows. Financial reports go stale. According to J.P. Morgan research, the longer a shutdown lasts, the harder it becomes to restart financial operations and reconcile accounts.
Logistics teams struggle to maintain visibility into supply chains, contracts, and procurement. Manual tracking systems can’t keep up when the people managing them aren’t working. Critical information gets lost. Vendors wait for answers. Projects stall.
The Value of Automation During Crisis
Automated data platforms solve these problems by removing the dependency on constant human intervention. These systems continue collecting, validating, and organizing data even when offices are understaffed.
Think about payroll processing. An automated system pulls time and attendance data, calculates pay, processes deductions, and generates reports without manual input. When HR staff are furloughed, the system keeps running. Employees still get paid on time. Benefits continue without interruption. When the shutdown ends, there’s no backlog to clear.
The same principle applies to financial operations. Automated data integration connects accounting systems, procurement platforms, and budget tracking tools. Transactions flow automatically. Reports update in real time. Finance teams can monitor spending and maintain compliance with skeleton crews.
For logistics, automation provides continuous visibility. Contract management systems track deadlines and deliverables. Inventory systems monitor stock levels. Procurement platforms maintain vendor relationships. These functions don’t pause when people do.
Three Pillars of Resilient Data Infrastructure
Building resilience requires more than just automation. Government agencies need data platforms built on three core principles.
Curation ensures data quality remains high regardless of staffing levels. Automated validation rules catch errors before they spread through systems. Standardized data formats make information easy to find and use. When operations resume after a shutdown, teams work with clean, reliable data instead of spending weeks fixing problems.
Governance maintains security and compliance during disruptions. Access controls protect sensitive information. Audit trails track every change. Approval workflows continue functioning even with reduced staff. These safeguards prevent the chaos that often follows a shutdown when agencies discover compliance gaps or security issues.
Integration connects systems across departments and functions. HR platforms talk to finance systems. Procurement tools share data with logistics. Budget tracking connects to spending analysis. This connectivity means information flows automatically instead of requiring people to manually transfer data between systems.
Measuring Recovery Time
The difference between manual and automated systems becomes obvious when measuring recovery time. Agencies using manual processes typically need three to four weeks to return to normal operations after a shutdown. They spend this time reconciling accounts, clearing backlogs, and fixing errors that accumulated during the disruption.
Agencies with automated data platforms recover in days instead of weeks. Their systems maintained data quality during the shutdown. Backlogs are minimal. Staff can focus on strategic work instead of administrative catch-up.
Function
Manual Process Recovery
Automated Platform Recovery
HR & Payroll
3-4 weeks
2-3 days
Financial Reporting
4-6 weeks
1 week
Contract Management
2-3 weeks
3-5 days
Budget Reconciliation
4-5 weeks
1-2 weeks
These time savings translate directly to cost savings. Less time spent on recovery means more time delivering services. Fewer errors mean less rework. Better data quality supports better decisions.
Building for the Next Disruption
Government shutdowns aren’t the only disruptions agencies face. Natural disasters, cybersecurity incidents, and public health emergencies create similar challenges. Automated data platforms provide resilience against all these scenarios.
The investment in data engineering and automation pays dividends every day, not just during crises. Staff spend less time on repetitive tasks. Leaders get better information faster. Agencies can redirect resources toward mission-critical work.
Starting this transformation doesn’t require replacing every system at once. Most agencies begin by automating their most manual processes. HR and finance functions offer quick wins because they involve repetitive tasks with clear rules. Success in these areas builds momentum for broader changes.
Working with experienced data analytics consultants helps agencies identify the right starting points and avoid common pitfalls. The goal isn’t technology for its own sake. The goal is building systems that keep working when everything else stops.
Moving Forward with Automation
The next shutdown will happen. The timing is uncertain, but the impact is predictable. Agencies that prepare now will maintain operations while others struggle. The difference comes down to infrastructure. Manual processes fail under pressure. Automated systems keep running.
Government leaders who invest in modern data platforms aren’t just preparing for shutdowns. They’re building the foundation for better service delivery, smarter resource allocation, and more effective operations every single day.
Whether you’re looking to automate HR processes, streamline financial reporting, or improve logistics visibility, our team can help you identify quick wins and build a roadmap for long-term resilience.
Schedule a consultation with our government data experts to discuss your specific challenges and discover how automated data platforms can transform your agency’s operations.
In 2025, the gap between data-driven organizations’ perception of AI Readiness and everyone else is widening fast. Budgets are tighter, expectations are higher, and leadership wants measurable outcomes instead of more tools. For teams working in Healthcare, Higher Education, and State & Local Government, the challenge is even more complex. You’re managing sensitive data across disconnected systems, meeting strict compliance requirements, and trying to deliver better outcomes with fewer resources.
This AI Readiness guide helps you assess where your data stack stands today. You’ll identify which maturity bucket you fall into: Lots of Work to Do, A Little Behind, or Right on Track—and understand the specific pain points holding you back from making data a strategic asset instead of an operational burden.
Quick Checklist for AI Readiness
Before we dive in, take a moment to score yourself on these nine capabilities. Answer yes or no to each:
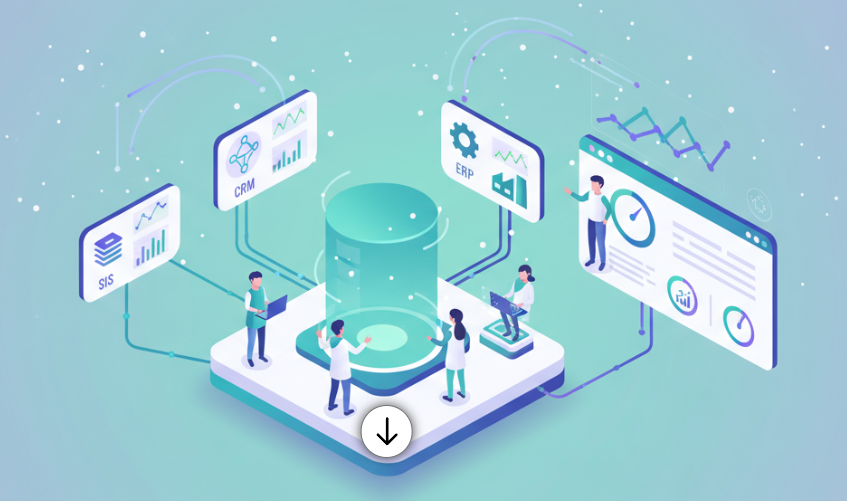
Do you have a single source of truth that consolidates data from your core systems like your EHR, SIS, ERP, CRM, and financial platforms?
Are your data pipelines monitored with clear SLAs so you know when something breaks before your users do?
Have you documented your key metrics and definitions in a way that everyone across departments can reference?
Do you have data quality tests and lineage tracking so you understand where your numbers come from and can trust them?
Are role-based access controls, PII tagging, and audit trails in place to meet compliance requirements?
Can you activate data back into operational tools to drive real-time decisions?
Do you have self-serve BI with governance policies and a process to deprecate unused dashboards?
Is cost observability built in so you can track usage, cost per query, and unit economics?
Do you have secure zones and frameworks ready for advanced analytics and AI use cases?
Scoring: 0–3 Yes: Lots of Work to Do 4–6 Yes: A Little Behind 7–9 Yes: Right on Track
Understanding the Maturity Buckets of AI Readiness
Lots of Work to Do
If you’re in this bucket, you’re likely dealing with data chaos on a daily basis. Your EHR, SIS, ERP, CRM, and financial systems are siloed islands. Data moves between them through manual CSV exports, email attachments, or one-off integrations that break without warning. When leadership asks for a report, it takes days or weeks to pull together, and even then, different departments come back with conflicting numbers because no one agrees on basic definitions.
You don’t have a clear data owner, and there’s no central place where people can go to find trusted metrics. Compliance is a constant worry because you’re not sure who has access to what, and audit trails are either nonexistent or buried in system logs no one ever checks. Your team spends more time firefighting data issues than actually analyzing anything, and trust in your numbers is low across the organization.
The risks here are significant. Poor data leads to poor decisions. Compliance exposure grows every day, according to HIPAA, FERPA, and state data protection standards. You’re likely overspending on tools that don’t talk to each other, and your team is demoralized because they’re stuck doing manual work instead of strategic analysis. If you’re in healthcare, this might mean delayed insights into denied claims or readmissions. In higher ed, it could be conflicting enrollment numbers that make it impossible to forecast revenue. For state and local government, it often shows up as slow responses to constituent requests and no visibility into program performance.
A Little Behind
If you’re in this bucket, you’ve made progress but you’re hitting new bottlenecks. You have a data warehouse or lakehouse that consolidates some of your core systems, but it’s not complete. Your EHR or SIS data might be there, but your CRM, financial aid, grants management, or constituent service platforms are still disconnected. Dashboards exist, but they’re slow, and users complain about stale data or unclear definitions.
You have some governance in place, but it’s ad-hoc. Access controls exist, but they’re not consistently enforced. PII and PHI tagging happens sometimes, but not systematically. When a pipeline breaks, you find out from an angry user instead of a monitoring alert. You’re starting to see your data costs climb, but you don’t have visibility into what’s driving them or which queries and dashboards are the culprits.
The risk here is that you’re stuck in the middle. You’ve invested in data integration and data engineering infrastructure, but adoption is plateauing because users don’t trust the data or find it too slow. Your pipelines are brittle and break when source systems change schemas. Costs are rising faster than value, and you’re not sure where to focus next. In healthcare, this might mean you have quality metrics dashboards, but care teams don’t use them because the data is two days old. In higher ed, you might have enrollment dashboards, but admissions and financial aid are still using different definitions of “yield.” For government, you might have 311 data in a warehouse, but no way to route high-priority tickets automatically.
Right on Track
If you’re in this bucket, your data stack is a strategic asset. You have a consolidated warehouse or lakehouse that brings together your EHR, claims, scheduling, and patient experience data in healthcare. In higher ed, your SIS, LMS, CRM, financial aid, and alumni systems feed a single source of truth. For government, your finance, constituent services, public safety, and program data are unified with clear lineage and ownership.
Your metrics are documented in a semantic layer that everyone references. When someone asks about readmission rates, enrollment yield, or service ticket resolution time, there’s one definition and one dashboard everyone trusts. Data quality tests run automatically, and lineage tracking means you can trace every number back to its source. Role-based access controls are enforced consistently, and sensitive data is tagged and governed with full audit trails that meet ONC Interoperability standards, IPEDS reporting requirements, and open data transparency mandates.
But what really sets you apart is activation and AI readiness. You’re not just reporting on what happened last week. You’re pushing insights back into operational systems in near real-time. In healthcare, that might mean care gap alerts flowing into your EHR or denials prevention signals going to your revenue cycle team. In higher ed, it’s at-risk student flags appearing in your advising CRM or personalized outreach campaigns triggered by engagement data. For government, it’s the automated routing of high-priority service requests or predictive maintenance alerts for infrastructure.
And you’re ready for AI. You have curated datasets and feature tables that are clean, documented, and safe for model training. You’ve established secure zones for experimentation with clear guardrails around sensitive data. You’re tracking model drift and data quality for any predictive or generative AI use cases, and you’re measuring business impact, not just technical metrics. You have frameworks in place to move from proof of concept to production quickly and responsibly. Your Analytics & AI services are embedded into daily operations, not sitting in a pilot phase.
Your cost observability is strong. You know your spend per department, per query, and per dashboard. You have a quarterly review process where you measure adoption, retire unused assets, and prioritize new data products based on ROI. Leadership sees the data team as a value driver, not a cost center.
Maturity Comparison at a Glance of AI Readiness
Capability
Lots of Work to Do
A Little Behind
Right on Track
Single source of truth (EHR/SIS/ERP/CRM)
❌ Siloed systems
⚠️ Partial consolidation
✅ Fully unified
Documented metrics & semantic layer
❌ No standards
⚠️ Inconsistent definitions
✅ Single source of truth
Data quality tests & lineage
❌ Manual checks
⚠️ Ad-hoc testing
✅ Automated & traceable
RBAC + PII/PHI/FERPA tagging
⚠️ Minimal controls
⚠️ Partial enforcement
✅ Full compliance + audit
Activation to operational tools
❌ No integration
⚠️ Limited syncs
✅ Real-time activation
Cost & usage observability
❌ No visibility
⚠️ Basic tracking
✅ Full transparency
AI-ready infrastructure
❌ Not prepared
⚠️ Pilot stage
✅ Production frameworks
Legend: ❌ Missing or minimal | ⚠️ Partial or inconsistent | ✅ Complete and mature
Common Pain Points Across Systems
Regardless of which bucket you’re in, certain pain points show up again and again when your stack isn’t where it needs to be.
Disconnected systems are the most common issue. Your EHR doesn’t talk to your claims platform. Your SIS is separate from your LMS and CRM. Your ERP is isolated from your grants management and constituent service tools. Every time you need a complete picture, you’re stitching together exports and hoping the joins are right.
Conflicting definitions create endless friction. What counts as an active patient, an enrolled student, or a resolved service ticket? Different departments have different answers, and no one has written anything down. This leads to endless meetings where people argue about whose numbers are right instead of making decisions.
Compliance anxiety keeps you up at night. You know you need to protect PHI, PII, and FERPA-protected data, but you’re not confident you know who has access to what. Audit trails are incomplete, and when auditors or regulators come calling, you’re scrambling to pull together documentation.
Slow time to insight frustrates everyone. When leadership asks a question, it takes days or weeks to answer because you’re starting from scratch every time. There’s no self-serve capability, so every request becomes a custom project for your already overwhelmed data team.
Rising costs with unclear value are a growing concern. Your cloud data warehouse bill keeps growing, but you’re not sure what’s driving it. You have dozens of dashboards, but you don’t know which ones people actually use. You’re paying for tools that might be redundant, but no one has time to audit and consolidate.
And AI unreadiness is the newest pressure point. Everyone is talking about AI, and leadership is asking what you’re doing with it, but your data isn’t in a state where you can responsibly train models or deploy AI use cases. You don’t have clean feature tables, you don’t have drift monitoring, and you don’t have secure zones for experimentation.
System-Specific Challenges by Sector for AI Readiness
Finance ↔ Program Data, 311 ↔ Work Orders, Grants ↔ Outcomes
Service routing, program transparency, cost-per-outcome
What Good Looks Like in Practice for AI Readiness
When your stack is right on track, the difference is tangible. In healthcare, your clinical and operational teams have real-time visibility into quality metrics, capacity, and revenue cycle performance. Denied claims are flagged before they’re submitted. High-risk patients are identified early, and care coordinators get next-best-action recommendations directly in their workflow. Your data supports value-based care contracts because you can measure and report outcomes reliably.
In higher education, your enrollment funnel is instrumented end-to-end. Admissions knows which programs and campaigns are driving yield. Advising teams get early alerts when students show signs of disengagement in the LMS. Financial aid and student accounts have a unified view of each student’s journey. Advancement teams can target alumni outreach based on engagement and giving history. And you can forecast enrollment and revenue with confidence because your definitions are consistent and your data is fresh.
In state and local government, your department heads have dashboards that show program performance and cost per outcome. Constituent service requests are routed intelligently based on priority and capacity. Public safety teams can analyze incident patterns to deploy resources more effectively. Capital projects have full spend and timeline transparency. And when it’s time to report to state or federal agencies, the data is already there, tested, and auditable.
Across all three sectors, your data team is focused on strategy instead of firefighting. Self-serve BI means business users can answer their own questions. Governance is built in, not bolted on. Costs are predictable and tied to value. And AI use cases are moving from pilots to production because the foundation is solid.
Where Do You Go From Here for AI Readiness?
If you scored yourself and realized you have lots of work to do, you’re not alone. Most organizations in healthcare, higher ed, and government are still in the early stages of data maturity. The good news is that the path forward is clear, but it requires expertise to navigate the complexity of your systems, compliance requirements, and organizational priorities.
If you’re a little behind, you’ve built the foundation, but now you need to focus on governance, activation, and cost control. That means implementing a semantic layer, enforcing access policies, adding lineage and quality tests, and pushing insights back into the operational tools your teams use every day. This is where data strategy consulting becomes critical to avoid costly missteps.
And if you’re right on track, your focus should be on optimization and innovation. That means tightening cost observability, expanding AI use cases with strong guardrails, and treating data as a product with clear ownership, SLAs, and lifecycle management.
The question isn’t whether your data stack needs to evolve. It’s whether you’re going to take control of that evolution or let it happen to you. If you’re ready to assess where you stand, identify your biggest gaps, and build a roadmap tailored to your systems and priorities, contact our team to get started.
Frequently Asked Questions about Readiness
What’s the quickest path to value for organizations just getting started? Consolidate your core systems into a single source of truth, define your golden metrics with clear ownership, and publish three dashboards everyone trusts. Then layer in governance and activation to operational tools.
How do we avoid tool sprawl and runaway costs? Start with a reference architecture and a metrics catalog. Track usage and cost per query. Sunset underused datasets and dashboards quarterly. Make sure every tool has a clear owner and measurable ROI.
How should we treat sensitive data like PHI, FERPA-protected records, and PII? Classify data at ingestion, enforce role-based access controls with full audit logs, and use de-identified or limited datasets for analytics work. Compliance should be built into your pipelines, not bolted on afterward.
When should we invest in advanced analytics and AI Readiness? After you have reliable pipelines, consistent definitions, and strong access controls in place. Begin with use cases tied directly to revenue, cost savings, or service outcomes. Measure business impact, not just technical performance.
What KPIs prove the stack is working? Reliability metrics like percentage of pipelines on time, adoption metrics like weekly active BI users, time-to-insight for new requests, and outcome metrics specific to your sector like denied claims reduction, enrollment yield lift, or service ticket resolution time.
Many teams feel the pressure to modernize reporting quickly. The result is a rush to buy tools, spin up dashboards, and promise smarter insights to leadership. What often happens next is disappointment. Reports do not match finance numbers, definitions shift from meeting to meeting, and trust erodes. The common thread is not the tool. It is the foundation beneath it. When the basics are weak, software only magnifies the gaps. The good news is that AI Strategy is achievable with a clear plan and steady ownership.
The Rush to Modern Reporting and Why It Backfires
There is a real sense of urgency across industries to upgrade reporting. Competitors show off slick visuals. Vendors share compelling demos. Leadership sets ambitious timelines. In that environment, it is easy to believe the next platform will fix long-standing issues. What follows is predictable. The new system connects to the same messy sources. The same conflicting definitions move forward untouched. Data quality problems resurface in new dashboards. Instead of better answers, teams now have faster confusion. Progress depends less on buying something new and more on preparing what you already have.
The Three Pillars Most Teams Skip of AI Strategy
Strong reporting sits on three simple pillars. They are not glamorous, but they are non-negotiable.
Pillar 1: Clean and Centralized Data
Data that lives in many places produces different answers to the same question. Customer records exist in CRM, billing, and support. Product names differ across catalogs. Dates are stored in different formats. A sales total in one system does not match the finance ledger in another. When reports draw from these sources directly, accuracy becomes a guessing game. A better approach starts with a data audit. Identify key systems. Map where core fields live. Profile the most important tables for completeness and duplicates. From there, consolidate into a single source of truth. That can be a data warehouse, a data lakehouse, or a well-structured dataset in a governed platform. The format matters less than the principle. Put the most important data in one place, clean it, and keep it in sync. When teams pull from the same foundation, discrepancies drop and trust rises.
Numbers do not explain themselves. Someone has to decide what counts as active users, what qualifies as revenue, and when a deal is considered closed. Without shared definitions, every department tells a slightly different story. Sales reports bookings, finance reports revenue recognition, and operations reports shipped units. None are wrong, but without alignment,dxsc they do not add up in the same meeting. The fix is straightforward. Write down the definitions that matter most. Document how each metric is calculated. Note inclusions, exclusions, time frames, and edge cases. Put these rules in a data dictionary that everyone can access. Then, implement the logic consistently in your data pipelines and models. When a metric changes, update the documentation and notify stakeholders. Clear definitions are the language of your business. If you want clear answers, you need a shared vocabulary.
Quality does not sustain itself. Someone must own it. In many organizations, data issues float between teams. Security is owned by IT, definitions are owned by analysts, and access is managed ad hoc. Over time, small exceptions become fragile patterns. A simple governance framework solves this. Assign data owners for key domains like customers, products, and finance. Define who approves changes to definitions and who grants access. Set up basic controls like role-based permissions and review logs. Schedule regular checks on data quality and pipeline health. Good governance is not bureaucracy. It is clear about who makes which decision and how changes move from idea to production. With ownership in place, teams stop firefighting and start improving.
Successful reporting follows a reliable sequence. First, assess your current state. List the systems, map the flows, and highlight the top pain points. Second, clean and centralize the most important data sets. Third, standardize definitions and encode them in your models. Fourth, automate the refresh process so data arrives on time without manual effort. Finally, add advanced features like predictive insights or natural language queries once the foundation is steady. This order matters. When you reverse it, you spend more time reconciling than learning. When you follow it, you create steady momentum and measurable wins.
Foundation Checklist: What to Verify Before You Build AI Strategy
The table below turns the foundation into clear checkpoints. Use it to structure your assessment and plan.
Area
What good looks like
How to verify
Common gaps
Sources and lineage
All key systems listed with data flows mapped
Role-based access with review process
Shadow exports and undocumented pipelines
Data quality
Key tables have high completeness and low duplicates
Profiling reports and data tests
Missing keys and inconsistent formats
Centralization
One trusted store for core data sets
Warehouse or governed dataset in use
Direct reporting against many sources
Definitions
Top metrics documented with clear logic
Data dictionary accessible to all
Multiple versions of the same metric
Access and security
One-off access and stale accounts
Permissions matrix and audit trail
One off access and stale accounts
Refresh and reliability
Automated schedules with monitoring
Pipeline run logs and alerts
Manual refreshes and silent failures
Quick Wins vs Long Term Improvements
It helps to separate immediate fixes from structural change. Quick wins often include standardizing a handful of high-visibility metrics, publishing a single source sales or revenue dataset, and automating a daily refresh for a key dashboard. These steps improve confidence fast. Long-term improvements include consolidating duplicate systems, establishing a formal data governance council, and investing in a documentation culture. Both tracks matter. Quick wins build trust. Structural work sustains it.
How Arc Analytics Builds the Foundation, Then Adds the Advanced Layer
Our approach starts with an assessment. We inventory your systems, map data flows, and identify the top five gaps that block reliable reporting. Next, we centralize and clean the most important data sets. We work with platforms like Qlik Cloud and Snowflake when they fit your stack, and we implement models that reflect your business rules. We help you document definitions in plain language and apply them consistently. We set up simple governance that names owners and clarifies decisions. Only then do we add advanced features on top. The result is not only better dashboards but also a foundation that scales as your questions evolve.
If you want to know where you stand, start with a short assessment. In thirty minutes, we can review your current setup, highlight the top risks, and suggest a clear next step. You will receive a readiness score, a concise gap analysis, and a simple plan to move forward. If you already know your top pain point, we can focus there first. If you prefer a broader view, we can cover the end-to-end picture.
Modern reporting delivers real value when it sits on a steady base. Clean and centralized data reduces noise. Clear definitions remove debate. Governance and ownership keep quality from drifting over time. With these pieces in place, advanced features become helpful rather than distracting. The path is practical and within reach. Start with an honest look at your current state, take a few decisive steps, and build momentum from there. If you want a partner to help you do it right, we are ready to assist.
Take action now: Contact Arc Analytics to assess your reporting foundation and build a plan that works.
Everyone is talking about AI. From predictive insights to next‑gen automation, it seems like the future is already here. Yet in reality, most organizations are still stuck pulling data manually from spreadsheets, ERPs, CRMs, and APIs.
Here’s the uncomfortable truth: you can’t skip straight to AI reporting if your foundation isn’t ready. Without proper data integration and automation, AI simply amplifies the chaos.
This post walks through the roadmap from spreadsheets to AI-driven reporting—and, more importantly, why each step matters if you want to stay competitive in a data‑driven economy.
The Problem With Jumping Too Fast Into AI
Businesses want to be “AI‑powered,” but:
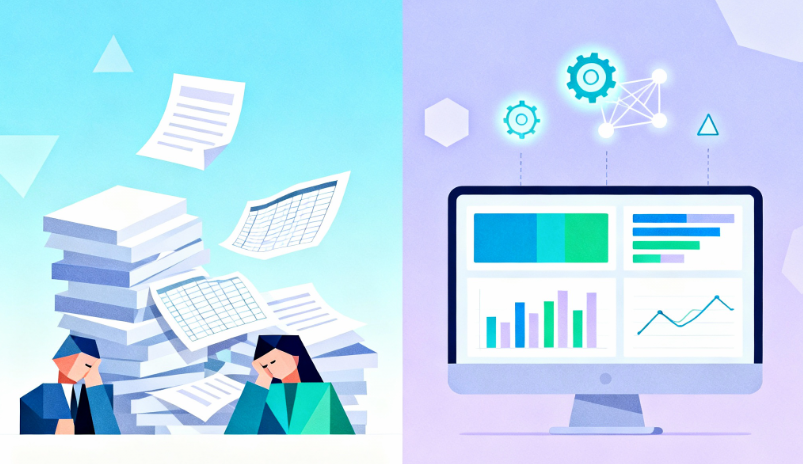
80% of analyst time is still spent just collecting and cleaning data.
Fragmented spreadsheets create errors and trust issues in reporting.
Without integration, AI models give misleading results because they’re only seeing part of the picture.
Think of it like building a skyscraper on a cracked foundation. You might put up flashy floors of “AI insights,” but sooner or later, the whole thing collapses.
Why It’s Important to Build the Roadmap
AI isn’t just about being trendy — it has the potential to:
Improve decision‑making with predictive forecasting.
Save costs by automating routine reporting tasks.
Give competitive advantage by spotting opportunities earlier.
But without the right data maturity path, those benefits never materialize. That’s where the roadmap comes in.
The Roadmap: From Spreadsheets to AI
Step 1: Eliminate Manual Reporting
Manual reporting = wasted time, higher risks.
Factor
Manual Reporting (Excel)
Automated Reporting (Qlik Cloud)
Time
Hours of copying & pasting
Refreshes instantly in real time
Accuracy
Prone to formula/user errors
Consistent, AI‑enhanced checks
Business Value
Lagging indicators
Timely, actionable insights
Collaboration
Static files emailed around
Shared dashboards for all teams
Why it matters: Every hour spent building spreadsheets is time not spent on strategy.
Step 2: Integrate Your Data Sourcesbefore AI
The biggest barrier to AI reporting? Silos. ERP, CRM, and financial systems each hold valuable data… but in isolation, they tell an incomplete story.
Arc Analytics is a full-service data analytics and integration consultancy based in Charlotte, NC, USA, specializing in the Qlik platform. Browse the posts below for practical Qlik tips, migration guidance, and real-world use cases from our consulting work.