If you are new to Qlik, it can be hard to know where to begin. There are many tools and many features, but you do not need to learn them all on day one. This short guide will give you a few simple things to think about as you get started.
You can follow along with the video series on our YouTube channel. As you go, you can also try Qlik for yourself and learn with others:
Qlik is a tool that helps you turn data into clear pictures and simple stories. Instead of digging through long spreadsheets, you can look at charts and dashboards that show what is going on in your business.
You do not have to be a data expert to use Qlik. The most important thing is to know what you care about. For example, you might want to see which products are selling best, how long customers wait, or where your team is falling behind. Qlik helps you see these answers in one place so you can make better choices.
You may hear two names: Qlik Sense and Qlik Cloud. Here is the simple way to think about them.
Qlik Sense is the name many people know from the last few years. It has been used to build dashboards and apps in many companies. Qlik Cloud is the newer, cloud-based home for Qlik. It runs in the cloud, so your team does not have to manage as much hardware or do as many updates.
If you are just starting now, Qlik Cloud is usually the best place to begin. It is easier to reach from anywhere, it gets new features faster, and it is what we focus on in our guides and videos. If you already use Qlik Sense or are not sure which one fits your plans, we can help you think it through at Arc Qlik Consulting Services or Arc Qlik Support.
What Is Qlik In 2026?
Qlik is changing. When you start now, you are not just learning today’s tool. You are getting ready for where Qlik is going.
By 2026, more work with Qlik will happen in the cloud. It will be easier to see numbers close to real time instead of waiting for a monthly report. Qlik will also be more connected to other tools you already use, so data can flow more smoothly across your systems.
Most of all, Qlik will be more than just “nice dashboards.” It will help you see what happened, what is happening right now, and what might happen next. When you plan your Qlik journey, try to think about the next few years, not just the next few weeks. If you want a partner to plan that path, you can explore Qlik Talend Data Fabric and Cloud Services.
Who Uses Qlik?
People in many roles and industries use Qlik every day. Business leaders use it to see key numbers in one place. Managers use it to track performance and spot problems. Analysts use it to dig deeper into data and share insights. Frontline staff use it to see simple views that guide their daily work.
Qlik is also common in healthcare, government, and education. You can see some of those use cases here:
As you get started, it helps to ask a few questions. Who needs to see the numbers? Who will own the main questions you want to answer? Who can help build and support Qlik over time? You do not need perfect answers, but even a simple picture of “who” will guide better choices
Getting Access
To get started, you need two things: a place to work and people to help you.
A free 30-day Qlik Cloud Analytics trial gives you a safe place to explore. You can log in, click around, and see if the tool fits your style without a big commitment. You can start that here: Free 30-day trial for Qlik Cloud Analytics
Support matters too. Joining Arc Academy for Qlik lets you learn with others, ask questions, and get guidance: Arc Academy for Qlik on Skool
You can also reach out to our team for help with training and setup through Training and Contact Us.
As you begin, write down one or two questions you want Qlik to answer. Start your trial, join the community, and follow along with the first video. Your first steps do not have to be perfect. They just need to move you closer to clear, useful insight from your data.
Many teams feel the pressure to modernize reporting quickly. The result is a rush to buy tools, spin up dashboards, and promise smarter insights to leadership. What often happens next is disappointment. Reports do not match finance numbers, definitions shift from meeting to meeting, and trust erodes. The common thread is not the tool. It is the foundation beneath it. When the basics are weak, software only magnifies the gaps. The good news is that AI Strategy is achievable with a clear plan and steady ownership.
The Rush to Modern Reporting and Why It Backfires
There is a real sense of urgency across industries to upgrade reporting. Competitors show off slick visuals. Vendors share compelling demos. Leadership sets ambitious timelines. In that environment, it is easy to believe the next platform will fix long-standing issues. What follows is predictable. The new system connects to the same messy sources. The same conflicting definitions move forward untouched. Data quality problems resurface in new dashboards. Instead of better answers, teams now have faster confusion. Progress depends less on buying something new and more on preparing what you already have.
The Three Pillars Most Teams Skip of AI Strategy
Strong reporting sits on three simple pillars. They are not glamorous, but they are non-negotiable.
Pillar 1: Clean and Centralized Data
Data that lives in many places produces different answers to the same question. Customer records exist in CRM, billing, and support. Product names differ across catalogs. Dates are stored in different formats. A sales total in one system does not match the finance ledger in another. When reports draw from these sources directly, accuracy becomes a guessing game. A better approach starts with a data audit. Identify key systems. Map where core fields live. Profile the most important tables for completeness and duplicates. From there, consolidate into a single source of truth. That can be a data warehouse, a data lakehouse, or a well-structured dataset in a governed platform. The format matters less than the principle. Put the most important data in one place, clean it, and keep it in sync. When teams pull from the same foundation, discrepancies drop and trust rises.
Numbers do not explain themselves. Someone has to decide what counts as active users, what qualifies as revenue, and when a deal is considered closed. Without shared definitions, every department tells a slightly different story. Sales reports bookings, finance reports revenue recognition, and operations reports shipped units. None are wrong, but without alignment,dxsc they do not add up in the same meeting. The fix is straightforward. Write down the definitions that matter most. Document how each metric is calculated. Note inclusions, exclusions, time frames, and edge cases. Put these rules in a data dictionary that everyone can access. Then, implement the logic consistently in your data pipelines and models. When a metric changes, update the documentation and notify stakeholders. Clear definitions are the language of your business. If you want clear answers, you need a shared vocabulary.
Quality does not sustain itself. Someone must own it. In many organizations, data issues float between teams. Security is owned by IT, definitions are owned by analysts, and access is managed ad hoc. Over time, small exceptions become fragile patterns. A simple governance framework solves this. Assign data owners for key domains like customers, products, and finance. Define who approves changes to definitions and who grants access. Set up basic controls like role-based permissions and review logs. Schedule regular checks on data quality and pipeline health. Good governance is not bureaucracy. It is clear about who makes which decision and how changes move from idea to production. With ownership in place, teams stop firefighting and start improving.
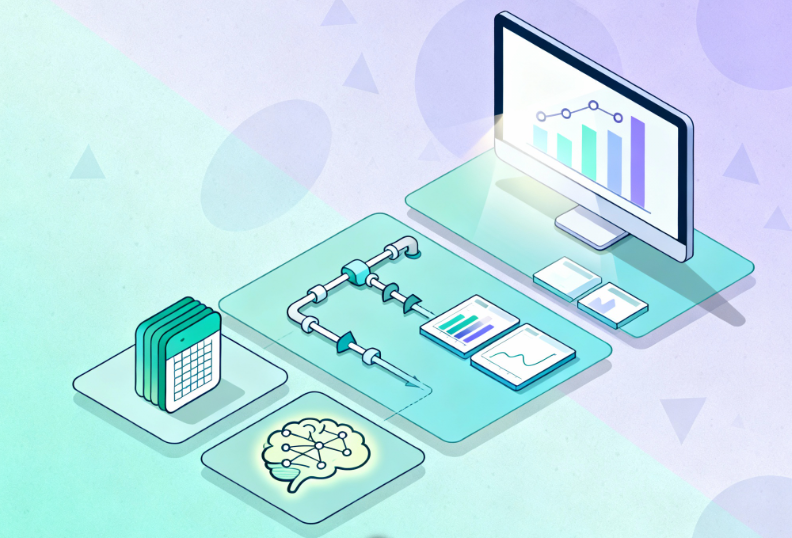
Successful reporting follows a reliable sequence. First, assess your current state. List the systems, map the flows, and highlight the top pain points. Second, clean and centralize the most important data sets. Third, standardize definitions and encode them in your models. Fourth, automate the refresh process so data arrives on time without manual effort. Finally, add advanced features like predictive insights or natural language queries once the foundation is steady. This order matters. When you reverse it, you spend more time reconciling than learning. When you follow it, you create steady momentum and measurable wins.
Foundation Checklist: What to Verify Before You Build AI Strategy
The table below turns the foundation into clear checkpoints. Use it to structure your assessment and plan.
Area
What good looks like
How to verify
Common gaps
Sources and lineage
All key systems listed with data flows mapped
Role-based access with review process
Shadow exports and undocumented pipelines
Data quality
Key tables have high completeness and low duplicates
Profiling reports and data tests
Missing keys and inconsistent formats
Centralization
One trusted store for core data sets
Warehouse or governed dataset in use
Direct reporting against many sources
Definitions
Top metrics documented with clear logic
Data dictionary accessible to all
Multiple versions of the same metric
Access and security
One-off access and stale accounts
Permissions matrix and audit trail
One off access and stale accounts
Refresh and reliability
Automated schedules with monitoring
Pipeline run logs and alerts
Manual refreshes and silent failures
Quick Wins vs Long Term Improvements
It helps to separate immediate fixes from structural change. Quick wins often include standardizing a handful of high-visibility metrics, publishing a single source sales or revenue dataset, and automating a daily refresh for a key dashboard. These steps improve confidence fast. Long-term improvements include consolidating duplicate systems, establishing a formal data governance council, and investing in a documentation culture. Both tracks matter. Quick wins build trust. Structural work sustains it.
How Arc Analytics Builds the Foundation, Then Adds the Advanced Layer
Our approach starts with an assessment. We inventory your systems, map data flows, and identify the top five gaps that block reliable reporting. Next, we centralize and clean the most important data sets. We work with platforms like Qlik Cloud and Snowflake when they fit your stack, and we implement models that reflect your business rules. We help you document definitions in plain language and apply them consistently. We set up simple governance that names owners and clarifies decisions. Only then do we add advanced features on top. The result is not only better dashboards but also a foundation that scales as your questions evolve.
If you want to know where you stand, start with a short assessment. In thirty minutes, we can review your current setup, highlight the top risks, and suggest a clear next step. You will receive a readiness score, a concise gap analysis, and a simple plan to move forward. If you already know your top pain point, we can focus there first. If you prefer a broader view, we can cover the end-to-end picture.
Modern reporting delivers real value when it sits on a steady base. Clean and centralized data reduces noise. Clear definitions remove debate. Governance and ownership keep quality from drifting over time. With these pieces in place, advanced features become helpful rather than distracting. The path is practical and within reach. Start with an honest look at your current state, take a few decisive steps, and build momentum from there. If you want a partner to help you do it right, we are ready to assist.
Take action now: Contact Arc Analytics to assess your reporting foundation and build a plan that works.
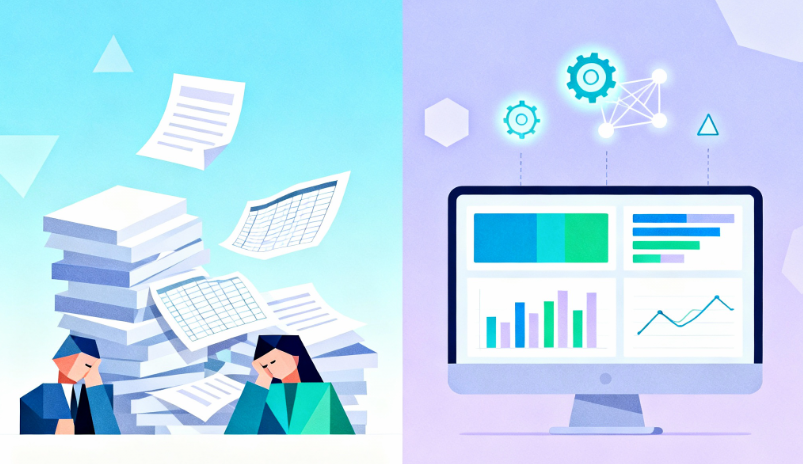
“AI reporting” is everywhere. Vendors promise magic; dashboards claim to be AI‑powered. But most organizations don’t need a science experiment; they need trusted, timely decisions. If your team is still stitching together spreadsheets from ERP, CRM, databases, and exports, AI won’t fix that. It will amplify it.
This post clarifies what AI reporting really is, what it isn’t, and the practical (and profitable) path to get there—without the buzzword bingo.
The Problem With the Hype
Ambiguous promises lead to misaligned expectations and stalled initiatives.
Teams operate in silos and rely on manual refreshes, so no one trusts the numbers.
Leaders buy “AI” before fixing foundations (integration, governance, adoption).
Result: expensive tools, low adoption, and insights that arrive too late to matter.
Why This Matters Now
AI isn’t just another tool category. When done right, it:
Improves decision‑making with explainable drivers and predictive signals.
Reduces cost by automating repetitive reporting work.
Creates competitive advantage by surfacing opportunities and risks earlier.
But without a solid data foundation, AI becomes a megaphone for bad data. The path to value is sequential, not magical.
What “AI Reporting” Actually Means
AI reporting is analytics augmented by machine intelligence to:
Surface anomalies and outliers you’d otherwise miss.
Explain KPI drivers (why something changed and what’s contributing).
Forecast trends with probabilistic confidence ranges.
Recommend next best actions or segments to target.
Answer natural‑language questions (NLQ) against governed data.
Think of AI as an accelerator on good data and sound models, and not a substitute for them.
What It Doesn’t Mean
Replacing strategic thinking or domain context.
Magically fixing messy, incomplete, or siloed data.
Instant ROI without integration, governance, and user enablement.
Fully autonomous decision‑making across the business.
The AI Reporting Maturity Path
Use this to align stakeholders and prioritize investments. It’s a staircase, not a leap.
Infographic concept (for your design team)
A four‑step staircase or pyramid labeled: 1) Spreadsheets & Manual, 2) Automation & Integration, 3) Real‑Time Dashboards, 4) AI‑Driven Insights. Add brief captions under each step (chaos → consistency → visibility → prediction).
Comparison table
Stage
What You Have
Risks If You Stop Here
What Unlocks Next Stage
Spreadsheets/Manual
CSVs, copy/paste, monthly decks
Errors, delays, no single source of truth
Connect ERP/CRM/DBs/APIs; standardize definitions
Automated & Integrated
Scheduled refresh, pipelines, governance
Faster but still reactive
Real‑time dashboards + event‑driven alerts
Real‑Time Dashboards
Live KPIs, alerts, shared access
Limited foresight
Add AI: anomaly detection, forecasting, NLQ
AI‑Driven Insights
Explanations, forecasts, recommendations
Change management/adoption
Training, guardrails, iterate on high‑ROI use cases
Use Cases That Work Right Now with AI Reporting
These are practical, budget‑friendly entry points that prove value in 30–90 days.
Function
AI Assist
Business Impact
Finance
Forecast + variance drivers
Faster, more confident decisions; fewer surprises
Sales/RevOps
Deal and pipeline risk scoring
Higher win rates; better focus on at‑risk deals
Operations
Anomaly detection on throughput/inventory
Lower waste; better service levels and OTIF
Executive
NLQ on governed KPIs + proactive alerts
Faster alignment; fewer status meetings
Prerequisites Most Teams Skip
Before you pilot AI reporting, confirm these boxes are checked:
Data integration across ERP/CRM/databases/APIs to eliminate silos
Data quality, lineage, and access controls so people trust the numbers
Automated refresh, monitoring, and incident alerts to replace manual reporting
Enablement and adoption plans so humans + AI actually work together.
Governance guardrails for responsible AI (auditability, bias, privacy).
Everyone is talking about AI. From predictive insights to next‑gen automation, it seems like the future is already here. Yet in reality, most organizations are still stuck pulling data manually from spreadsheets, ERPs, CRMs, and APIs.
Here’s the uncomfortable truth: you can’t skip straight to AI reporting if your foundation isn’t ready. Without proper data integration and automation, AI simply amplifies the chaos.
This post walks through the roadmap from spreadsheets to AI-driven reporting—and, more importantly, why each step matters if you want to stay competitive in a data‑driven economy.
The Problem With Jumping Too Fast Into AI
Businesses want to be “AI‑powered,” but:
80% of analyst time is still spent just collecting and cleaning data.
Fragmented spreadsheets create errors and trust issues in reporting.
Without integration, AI models give misleading results because they’re only seeing part of the picture.
Think of it like building a skyscraper on a cracked foundation. You might put up flashy floors of “AI insights,” but sooner or later, the whole thing collapses.
Why It’s Important to Build the Roadmap
AI isn’t just about being trendy — it has the potential to:
Improve decision‑making with predictive forecasting.
Save costs by automating routine reporting tasks.
Give competitive advantage by spotting opportunities earlier.
But without the right data maturity path, those benefits never materialize. That’s where the roadmap comes in.
The Roadmap: From Spreadsheets to AI
Step 1: Eliminate Manual Reporting
Manual reporting = wasted time, higher risks.
Factor
Manual Reporting (Excel)
Automated Reporting (Qlik Cloud)
Time
Hours of copying & pasting
Refreshes instantly in real time
Accuracy
Prone to formula/user errors
Consistent, AI‑enhanced checks
Business Value
Lagging indicators
Timely, actionable insights
Collaboration
Static files emailed around
Shared dashboards for all teams
Why it matters: Every hour spent building spreadsheets is time not spent on strategy.
Step 2: Integrate Your Data Sourcesbefore AI
The biggest barrier to AI reporting? Silos. ERP, CRM, and financial systems each hold valuable data… but in isolation, they tell an incomplete story.
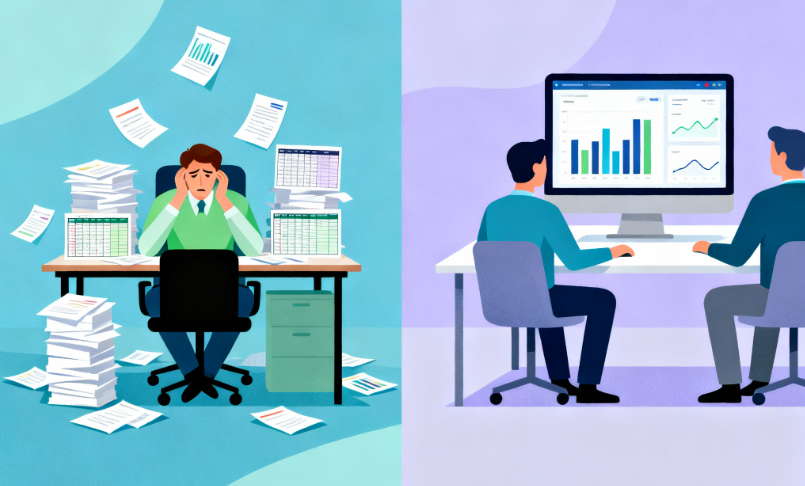
In today’s digital-first economy, speed and accuracy define competitiveness. Yet, many businesses still rely on tedious manual reporting — pulling fragmented data from ERP systems, CRMs, spreadsheets, databases, and APIs. This isn’t just inefficient; it’s dangerous for decision-making.
The truth is simple: manual reports no longer belong in the 21st century. Artificial Intelligence, cloud analytics, and automated platforms like Qlik Cloud, paired with Arc Analytics services, remove the friction, reduce risk, and unlock real-time insights that drive growth.
The Problem with Manual Reporting
When reporting depends on cut-and-paste work from multiple silos, organizations face recurring pain points:
Lost Productivity: Employees spend hours creating the same static reports every week.
Human Errors: Simple mistakes in formulas or data consolidation lead to costly missteps.
Outdated Insights: By the time reports are compiled, the data is already old.
Fragmentation: Data scattered across tools (ERP, CRM, Excel) is nearly impossible to consolidate seamlessly.
Here’s a quick comparison:
Factor
Manual Reporting
Automated Reporting (Qlik Cloud)
Time Spent
Hours/days of repetitive work
Instant refresh in real time
Accuracy
High chance of errors
Consistent, AI-enhanced checks
Scalability
Difficult as data grows
Effortless across unlimited sources
Collaboration
Static files emailed around
Live dashboards for all stakeholders
If you’re still relying heavily on Excel fire drills, you’re missing the opportunity to lead with confidence and agility.
Why Automation + Analytics Matter
Manual reports are reactive. Automation shifts analytics to being proactive and predictive. Imagine:
Real-time dashboards updating every time data changes in your system.
AI algorithms highlighting anomalies, trends, and risks before they escalate.
Workflows automated so teams focus on insights, not grunt work.
Predictive recommendations that help leaders make better, faster calls.
Instead of using reports as a rear-view mirror, automated analytics makes them your GPS for decision-making.
Arc Services: Your Partner in AI Reporting
At Arc Analytics, we specialize in creating seamless reporting ecosystems. We don’t just install tools; we transform reporting and analytics into strategic assets.
We work with you to:
Integrate all data sources: from ERP to CRM to Excel spreadsheets, APIs, and legacy systems.
Design real-time dashboards tailored to your KPIs and industry.
Enable adoption: training teams so they can confidently use Qlik Cloud.
Ensure governance and scale: sustainable, secure reporting frameworks that grow with your business.
Our expertise unlocks the full potential of Qlik while tailoring solutions to your unique challenges.
Why Qlik Cloud Changes the Game for Reporting
Qlik Cloud is built for businesses that want to eliminate inefficiencies and embrace modern analytics.
Core Benefits of Qlik Cloud
AI-Powered Insights: Natural-language queries simplify analytics for non-technical users.
Arc Analytics is a full-service data analytics and integration consultancy based in Charlotte, NC, USA, specializing in the Qlik platform. Browse the posts below for practical Qlik tips, migration guidance, and real-world use cases from our consulting work.